How Digital Dashboard improves Analytical Process in Logistics Industry?
“Data is the oil of the 21st century and analytics is the combustion engine.”
Data analytics is the key to a better future for your enterprise. To resolve complexities and resource allocation, the logistics industry has shifted its path towards a single-screen view of all critical data. The logistics industry needs more personalised results to understand large amounts of complex information, at a glance. If the data is used wisely, then the logistics partners can reap more benefits.
Many logistics companies struggle to find a way to analyse and use the data. The question is, there is so much data on board and very little time to use it, so, how can they use it wisely?
The answer is, through the digital dashboard tracker. It is the best way to dive deep into the data and analyse it for better use. A digital dashboard is an interactive visual representation that allows enterprises to build strategy and act accordingly. It can give birth to amazing insights that can boost productivity and offer you more informed decision-making.

We, at Fibonalabs, have created such intuitive digital dashboards which have given various logistics companies a different perspective on their business in real-time.
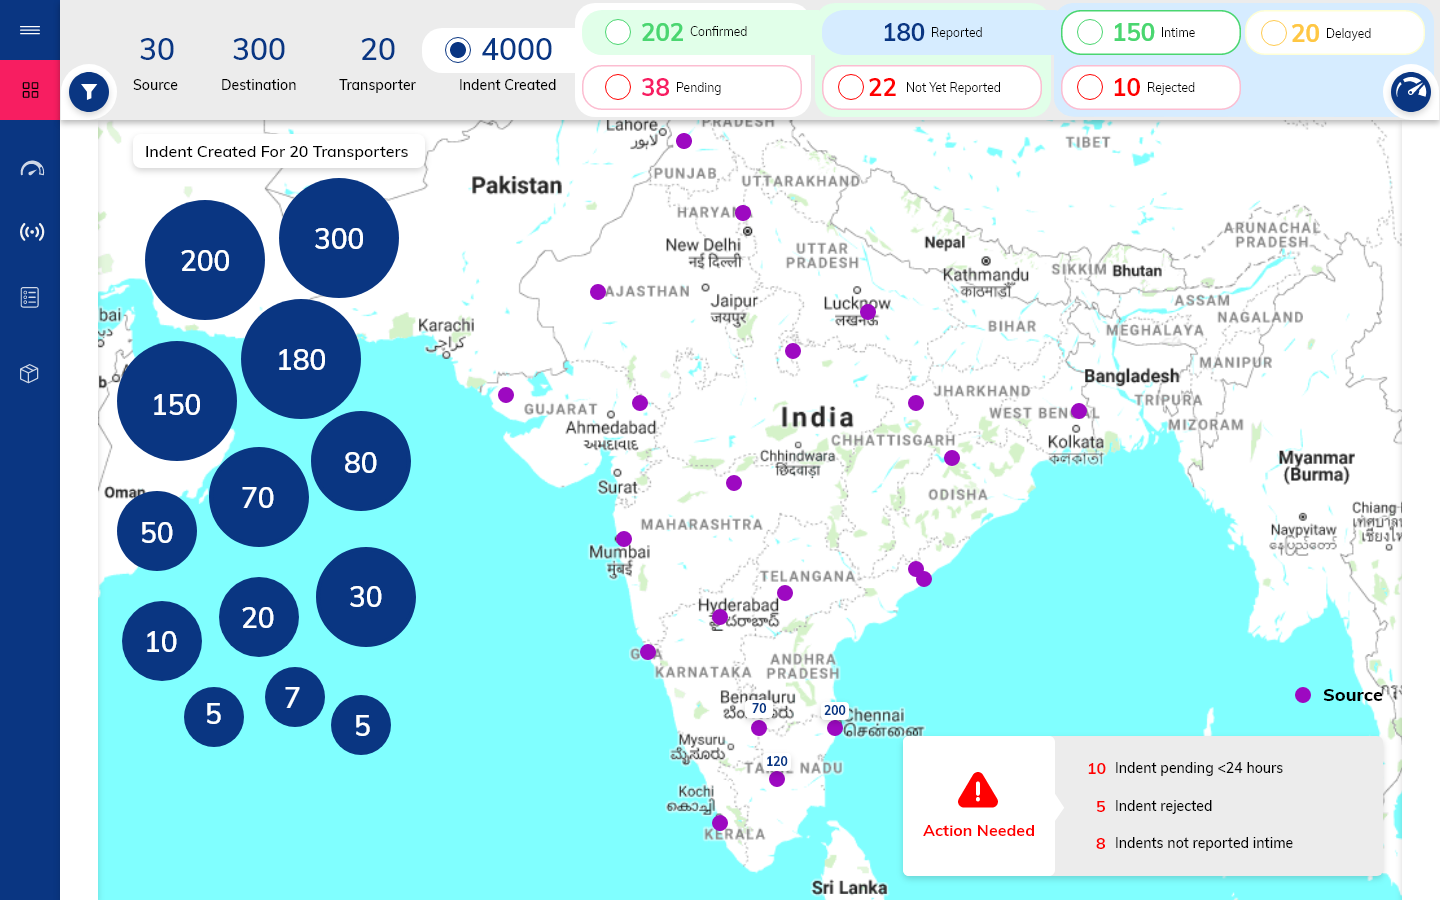
The design and development team of Fibonalabs worked for the intelligent control towers to monitor, manage, execute, and control decisions by providing a visual and graphical representation of the complete logistics system. These dashboards provide real-time visibility of the logistic ecosystem.

These control towers offer collaborative information sharing, real-time tracking of turn-around time (TAT), end-to-end visibility, and information about the placement index (PI). These dashboards provide real-time visibility of the logistic ecosystem, enabling faster and more effective decision-making by key stakeholders.
In these digital dashboards, we offer personalised functionalities according to the client’s requirements. Dashboards can present different information for different contexts. From warehouse managers to regional supervisors and CEOs to truck drivers, these digital dashboards leverage data in a better way for everyone.

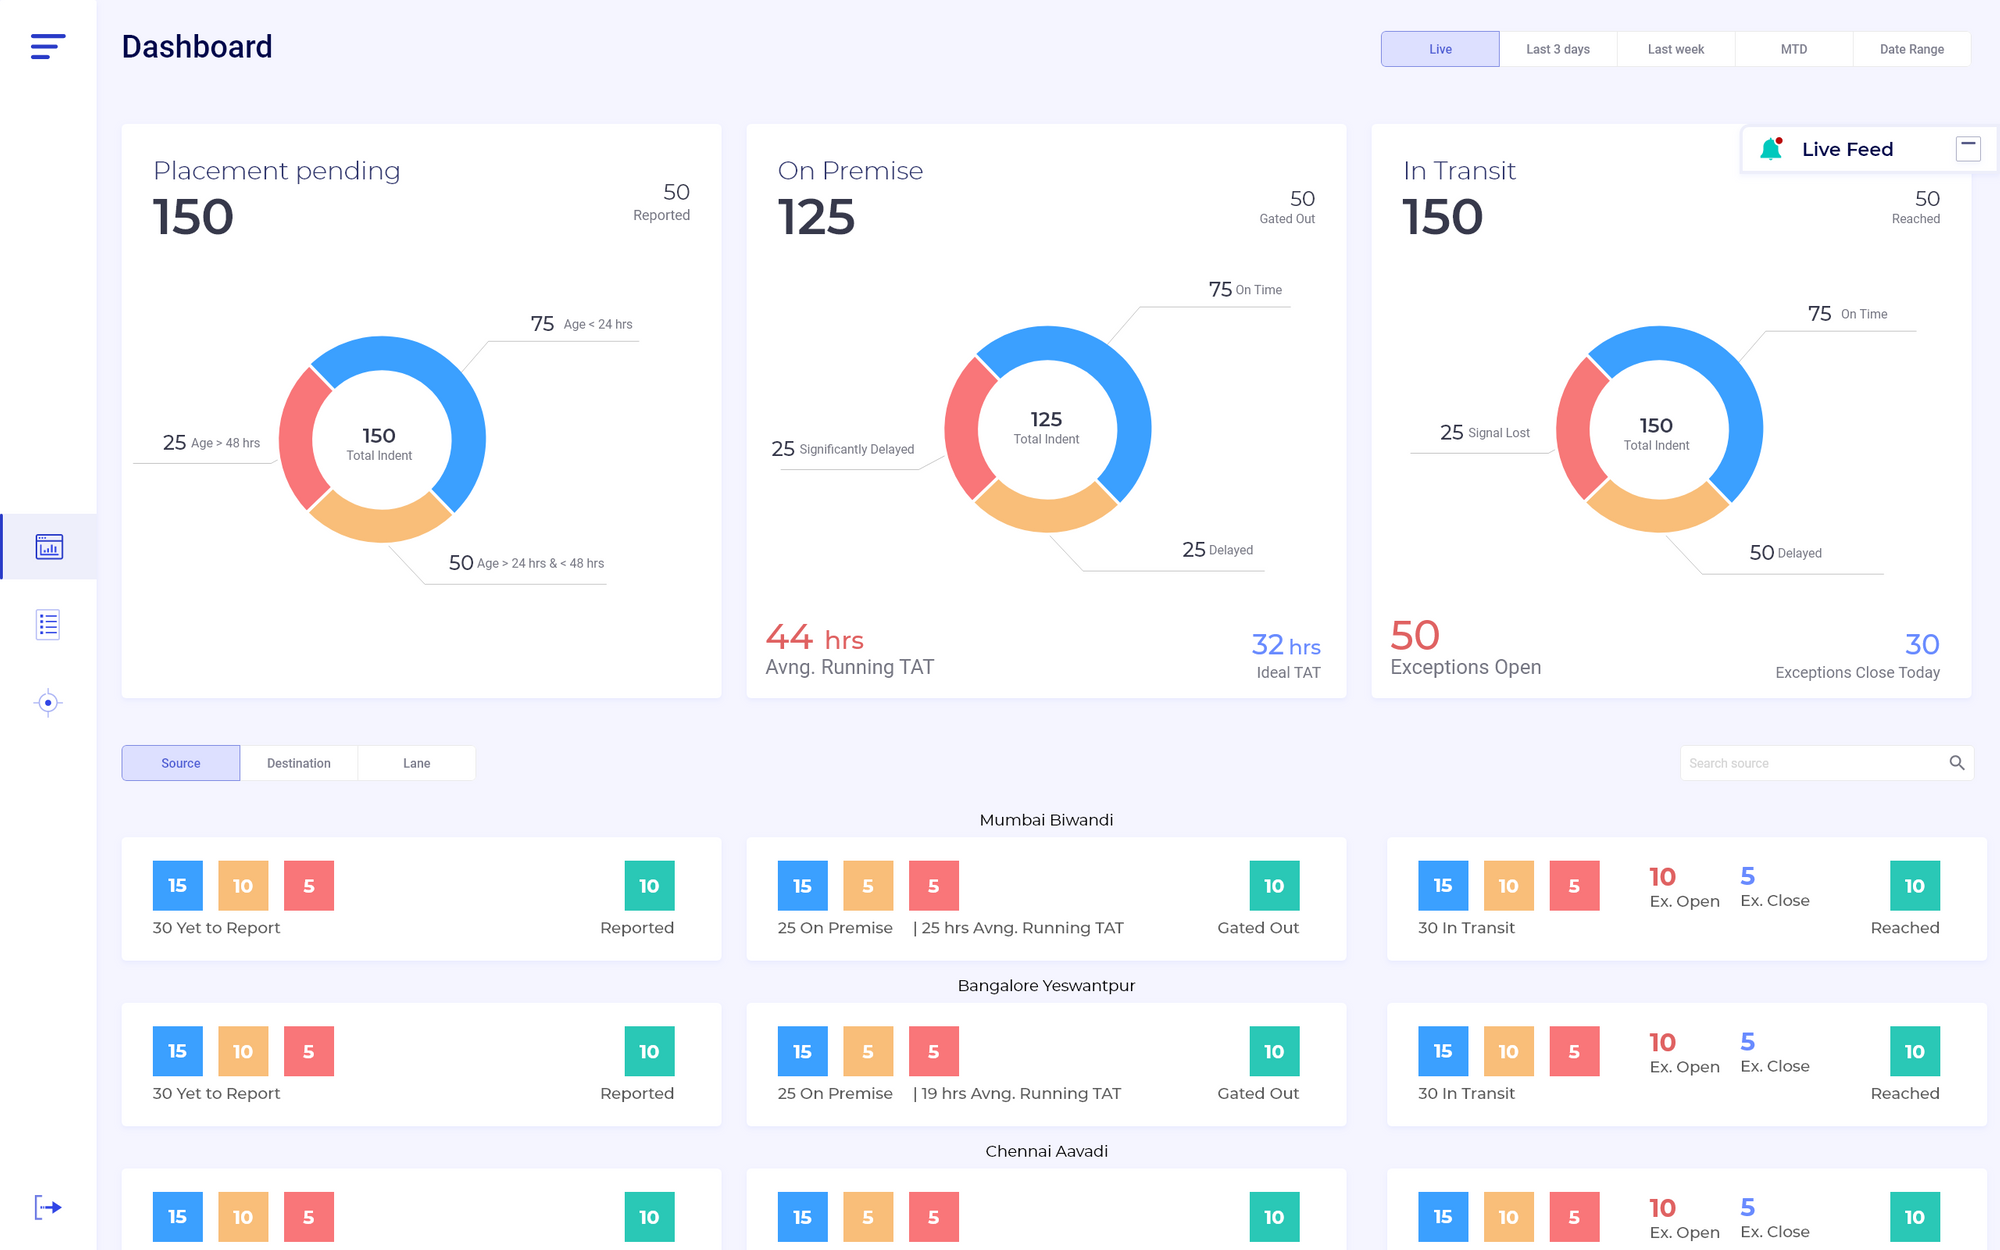
- Periodic Filters: With the periodic filters the key members can see the indent status for the different periods.
- Doughnut Pie Charts: From the dashboard with the help of doughnut pie charts, managers, and supervisors can track real-time data of the indents. This chart sheds information about the confirmation, reporting, pending, and cancellation of indent. Usage of various colours that give clear visibility about each stage.
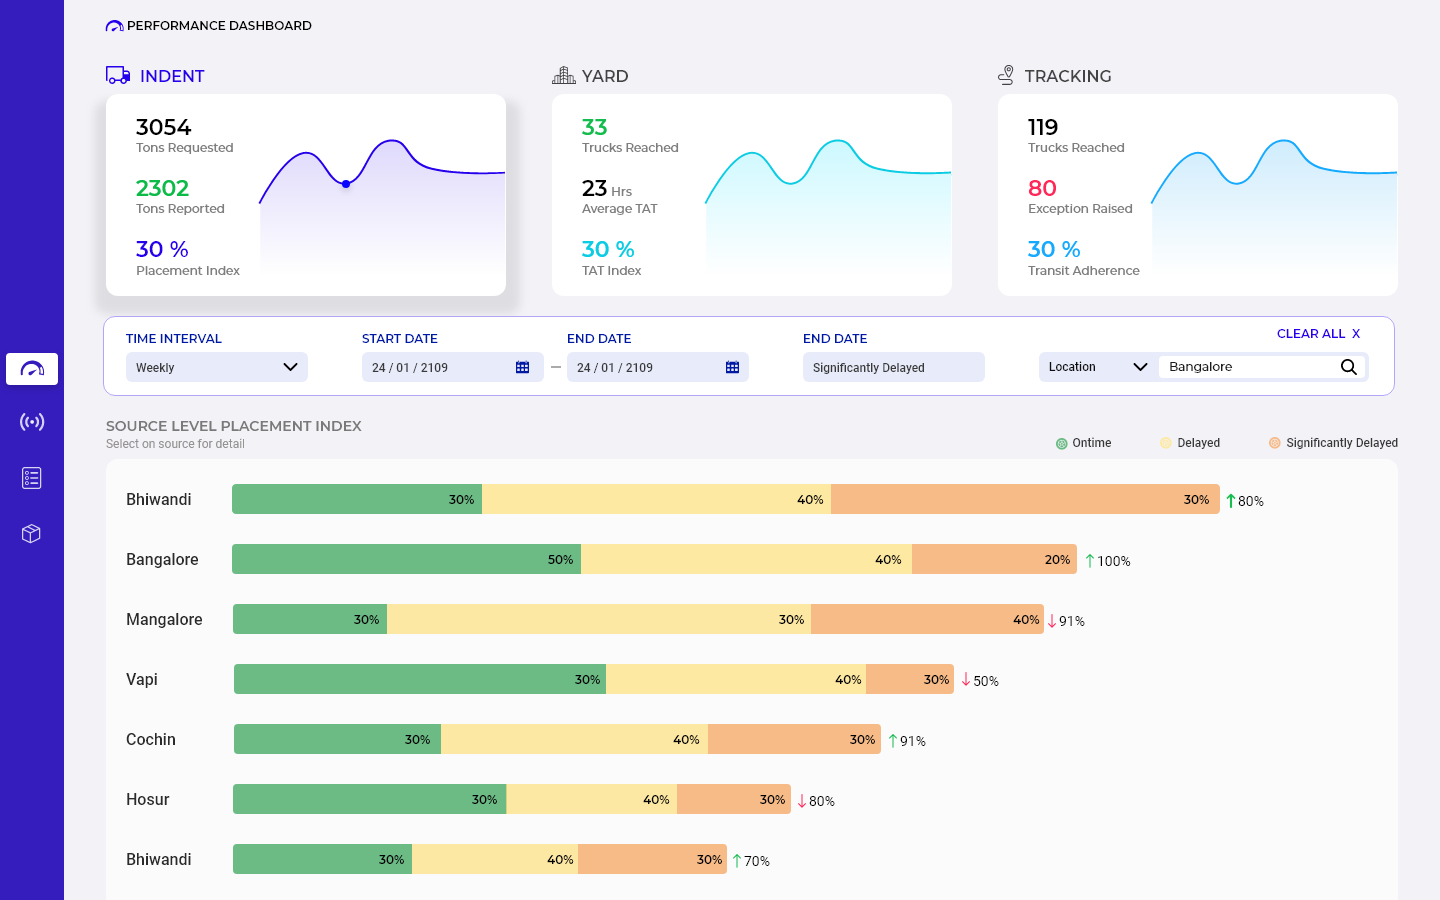
- Stacked Bar Charts: With the help of stacked bar charts, stakeholders and managers will able to analyze the Placement Index, Transit Time Adherence (TAT) Index, and Transit Adherence Index for more than one truck.
- Toggle Button: This helps with switching between lanes and sources to get complete information about the particular truck. It also gives information about the percentages of PI and TAT of that truck.
The intelligent control tower allows the logistics industry to work smarter and faster. It benefits the entire ecosystem with a fast delivery process, end-to-end visibility, collaboration, and autonomous capabilities.

We have designed digital dashboards for logistics companies to analyse the daily, monthly, and yearly reports and build strategies accordingly. It is a time-saving, constructive, and easy way to simplify logistics.
The graphical and visual representation of data is also accessible through mobile devices. Our digital dashboards are easy to access and navigate. So, if you are looking forward to introducing a digital dashboard tracker in your business then we are here to help you. We provide a tailor-made digital dashboard tracker build on the latest technology with an attractive interface.


